绘制邻居间的距离网格#
在研究细胞之间的邻里关系时,例如确定细胞是否能够相互通信,它们之间的距离是相关的。我们可以使用距离网格来可视化这些关系。
import pyclesperanto_prototype as cle
from numpy import random
from skimage.io import imread
我们使用的是由Heriche等人发布的数据集,以CC BY 4.0许可证发布,可在Image Data Resource上获取。
raw_image = imread("../../data/plate1_1_013 [Well 5, Field 1 (Spot 5)].png")[:,:,0]
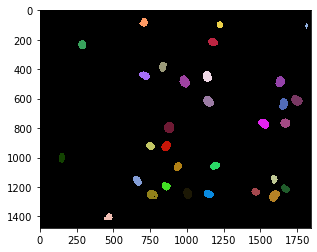
nuclei = cle.voronoi_otsu_labeling(raw_image, spot_sigma=15)
cle.imshow(nuclei, labels=True)
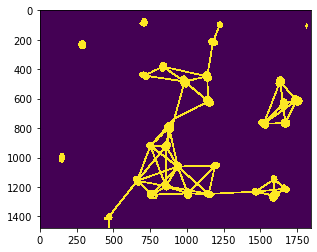
例如,可以在邻近的邻居之间绘制网格,即距离小于给定最大距离的细胞核。
max_distance = 320

proximal_neighbor_mesh = cle.draw_mesh_between_proximal_labels(nuclei, maximum_distance=max_distance)

# 为了可视化目的,我们将线条稍微加粗
proximal_neighbor_mesh = cle.maximum_box(proximal_neighbor_mesh, radius_x=5, radius_y=5)

cle.imshow(proximal_neighbor_mesh)
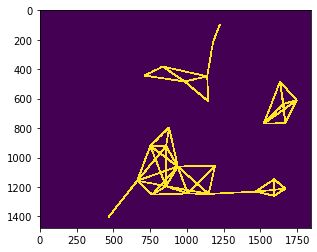
proximal_distance_mesh = cle.draw_distance_mesh_between_proximal_labels(nuclei, maximum_distance=max_distance)

# 为了可视化目的,我们将线条稍微加粗
proximal_distance_mesh = cle.maximum_box(proximal_distance_mesh, radius_x=5, radius_y=5)

cle.imshow(proximal_distance_mesh)
距离网格的更多细节#
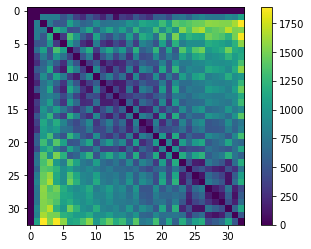
要绘制距离网格,我们需要结合距离矩阵(所有对象之间距离的抽象表示)和邻域矩阵(表示哪些细胞是邻居)。
我们先从距离矩阵开始。
centroids = cle.centroids_of_background_and_labels(nuclei)

distance_matrix = cle.generate_distance_matrix(centroids, centroids)

# 我们忽略与背景对象的距离
cle.set_column(distance_matrix, 0, 0)
cle.set_row(distance_matrix, 0, 0)

cle.imshow(distance_matrix, colorbar=True)
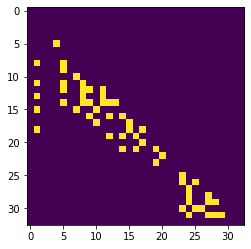
接下来,我们应该设置一个矩阵,表示每个细胞核(从左到右)的n个最近邻居。
proximal_neighbor_matrix = cle.generate_proximal_neighbors_matrix(distance_matrix, max_distance=max_distance)

cle.imshow(proximal_neighbor_matrix)
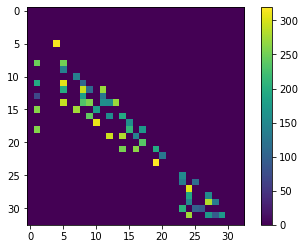
distance_touch_matrix = distance_matrix * proximal_neighbor_matrix

cle.imshow(distance_touch_matrix, colorbar=True)
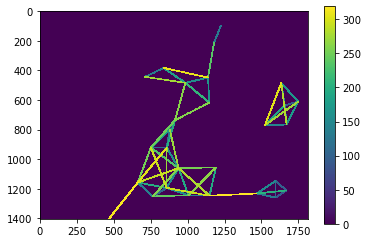
distance_mesh1 = cle.touch_matrix_to_mesh(centroids, distance_touch_matrix)

# 为了可视化目的,我们将线条稍微加粗
distance_mesh1 = cle.maximum_box(distance_mesh1, radius_x=5, radius_y=5)

cle.imshow(distance_mesh1, colorbar=True)
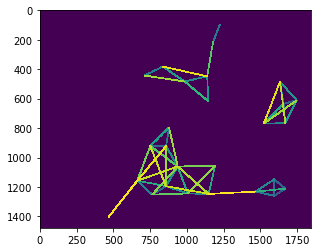
为了检查上面的细胞核是否仍然是网格的中心,我们将两者放在一张图像中。
visualization = cle.maximum_images(nuclei > 0, distance_mesh1 > 0)

cle.imshow(visualization)