图像中[多条]线的描述性统计#
在研究图像中多条线的强度时,可以在GPU上并行进行。本笔记本为说明目的仅演示了两条线。可以假设在GPU上并行读取数百或数千条线在性能方面是有意义的。
import pyclesperanto_prototype as cle
from skimage.data import cells3d
import numpy as np
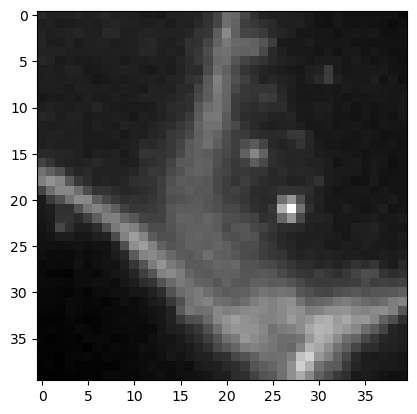
为了演示潜在的用例,我们仔细观察一张表达膜标记物的细胞图像。
membranes = cells3d()[30, 0, 110:150, 110:150]
cle.imshow(membranes)
我们定义四个点的坐标,这些点将连接成两条线。连接将使用一个_touch_矩阵完成,该矩阵允许将n个点与n个点连接。
coords = np.asarray([
    [0, 17],  # line 1 start (x, y)
    [10, 24], # line 1 end
    [20, 21], # line 2
    [35, 21]
]).T
connection_matrix = cle.symmetric_maximum_matrix(np.asarray([
    [0, 0, 0, 0, 0],
    [0, 0, 1, 0, 0], # this connects the two points of line 1
    [0, 0, 0, 0, 0],
    [0, 0, 0, 0, 1], # this connects the two points of line 2
    [0, 0, 0, 0, 0]
]))
connection_matrix
cle.array([[0. 0. 0. 0. 0.]
 [0. 0. 1. 0. 0.]
 [0. 1. 0. 0. 0.]
 [0. 0. 0. 0. 1.]
 [0. 0. 0. 1. 0.]], dtype=float32)
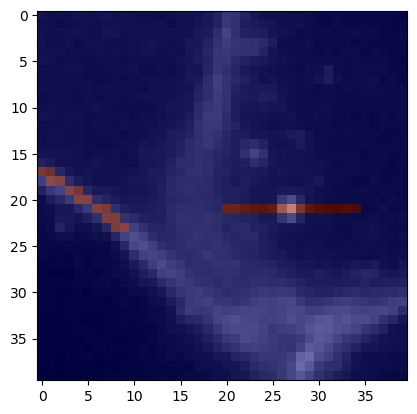
首先,我们在膜图像上可视化这些线。
mesh = cle.create_like(membranes)
mesh = cle.touch_matrix_to_mesh(coords, connection_matrix, mesh)

cle.imshow(membranes, continue_drawing=True)
cle.imshow(mesh, alpha=0.5, colormap='jet')
测量线上的平均强度#
接下来,我们使用上面配置的矩阵来测量线上的平均强度。我们还需要指定在线上将采样多少个点。
num_samples = 10

mean_intensity_matrix = cle.generate_mean_intensity_between_points_matrix(
                                membranes, coords, connection_matrix, num_samples=num_samples)
mean_intensity_matrix
cle.array([[   0.     0.     0.     0.     0. ]
 [   0.     0.  7317.8    0.     0. ]
 [   0.  7317.8    0.     0.     0. ]
 [   0.     0.     0.     0.  4482.6]
 [   0.     0.     0.  4482.6    0. ]], dtype=float32)
我们也可以将这些测量结果再次可视化为线。由于我们以矩阵形式传递点和点之间的连接,从技术上讲这是一个网格。
mean_intensity_mesh = cle.create_like(membranes)
mean_intensity_mesh = cle.touch_matrix_to_mesh(coords, mean_intensity_matrix, mean_intensity_mesh)
mean_intensity_mesh

|
cle._ image

|
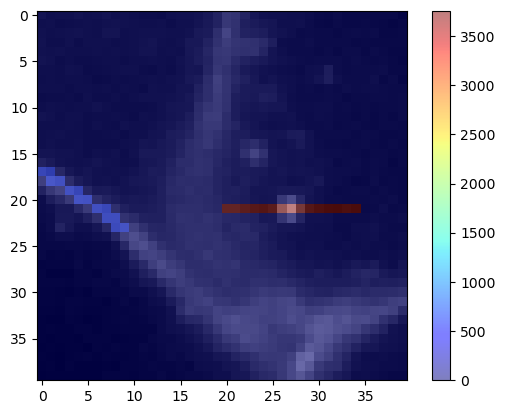
我们还可以在原始膜图像上可视化这个定量网格。
cle.imshow(membranes, continue_drawing=True)
cle.imshow(mean_intensity_mesh, alpha=0.5, colormap='jet', colorbar=True)

测量线上的强度标准差#
同样的程序也适用于测量线上的标准差。
stddev_intensity_matrix = cle.generate_standard_deviation_intensity_between_points_matrix(
                                membranes, coords, connection_matrix)
stddev_intensity_matrix
cle.array([[   0.         0.         0.         0.         0.     ]
 [   0.         0.       572.79144    0.         0.     ]
 [   0.       572.79144    0.         0.         0.     ]
 [   0.         0.         0.         0.      3758.1768 ]
 [   0.         0.         0.      3758.1772     0.     ]], dtype=float32)
stddev_intensity_mesh = cle.create_like(membranes)
stddev_intensity_mesh = cle.touch_matrix_to_mesh(coords, stddev_intensity_matrix, stddev_intensity_mesh)

cle.imshow(membranes, continue_drawing=True)
cle.imshow(stddev_intensity_mesh, alpha=0.5, colormap='jet', colorbar=True)