可视化表面#
在这个笔记本中,我们从一个胚胎样体的3D数据集创建了一个表面网格。所使用的示例数据源自 AV Luque 和 JV Veenvliet (2023),遵循 CC-BY 许可。关于如何从原始成像数据创建表面,请参见 creating_surfaces。
我们使用 napari-process-points-and-surfaces、vedo 和 napari 来可视化表面。
import napari_process_points_and_surfaces as nppas

import vedo
import napari
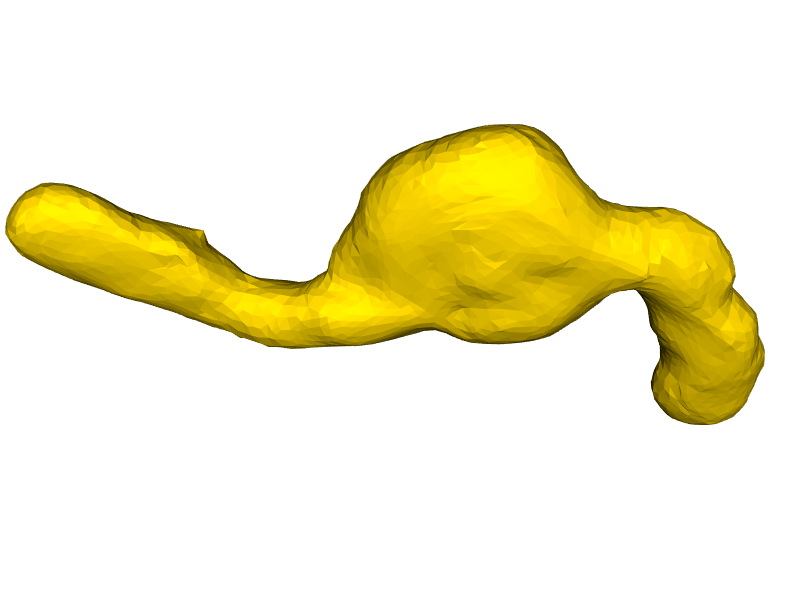
surface = nppas.gastruloid()
The nppas gastruloid example is derived from AV Luque and JV Veenvliet (2023) which is licensed CC-BY (https://creativecommons.org/licenses/by/4.0/legalcode) and can be downloaded from here: https://zenodo.org/record/7603081
在Jupyter笔记本中,结果对象的可视化如下:
surface

|
nppas.SurfaceTuple
|
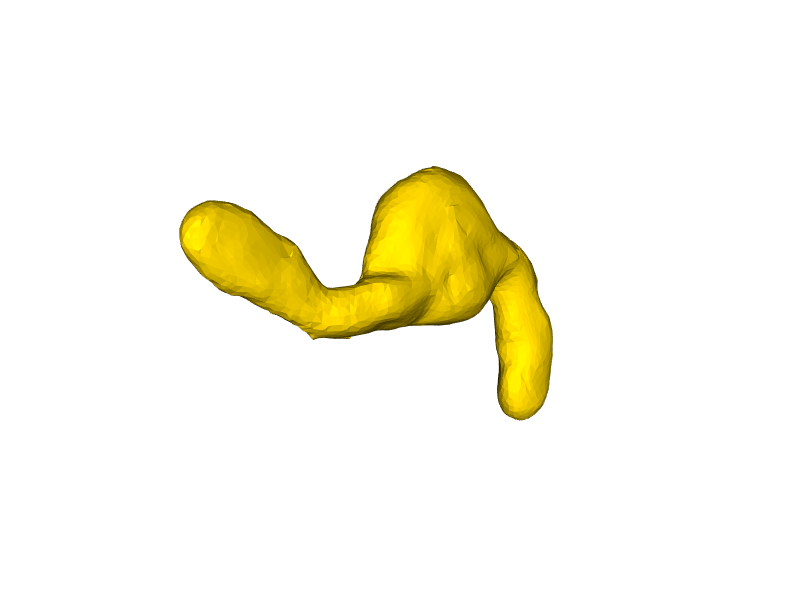
surface2 = nppas.add_quality(surface, nppas.Quality.SPHERE_FITTED_CURVATURE_HECTA_VOXEL)
surface2.azimuth = -90
surface2

|
nppas.SurfaceTuple

|
使用 napari-process-points-and-surfaces 的 nazimuths.show() 可视化表面#
你可以使用 nppas.show() 来调整可视化效果。
nppas.show(surface, zoom=1.5, azimuth=90, elevation=45)
使用 vedo 可视化表面#
… 使用 vedo Plotter。
from vedo import Plotter

plt = Plotter()
mesh = nppas.to_vedo_mesh(surface)

plt.show(mesh, zoom=1, azimuth=45)
使用 napari 可视化表面#
import napari
viewer = napari.Viewer(ndisplay=3)

viewer.add_surface(surface)

napari.utils.nbscreenshot(viewer)

viewer.add_surface(surface2, colormap=surface2.cmap)

napari.utils.nbscreenshot(viewer)
