图像是数字数组#
Numpy 是一个用于处理多维数字列表的库,其中显微镜图像(堆栈、多通道、时间序列等)是一个突出的例子。我们在这里介绍这个库。
另请参阅
import numpy as np
from matplotlib.pyplot import imshow
Numpy 数组#
一张图像只是一个二维像素值列表,换句话说,是一个矩阵,有一定数量的行和列。因此,我们可以将其定义为列表的列表,每个列表都是一行像素:
raw_image_array = [
    [1, 0, 2, 1, 0, 0, 0],
    [0, 3, 1, 0, 1, 0, 1],
    [0, 5, 5, 1, 0, 1, 0],
    [0, 6, 6, 5, 1, 0, 2],
    [0, 0, 5, 6, 3, 0, 1],
    [0, 1, 2, 1, 0, 0, 1],
    [1, 0, 1, 0, 0, 1, 0]
]
raw_image_array
[[1, 0, 2, 1, 0, 0, 0],
 [0, 3, 1, 0, 1, 0, 1],
 [0, 5, 5, 1, 0, 1, 0],
 [0, 6, 6, 5, 1, 0, 2],
 [0, 0, 5, 6, 3, 0, 1],
 [0, 1, 2, 1, 0, 0, 1],
 [1, 0, 1, 0, 0, 1, 0]]
imshow(raw_image_array)
<matplotlib.image.AxesImage at 0x1f9fbdb4b80>
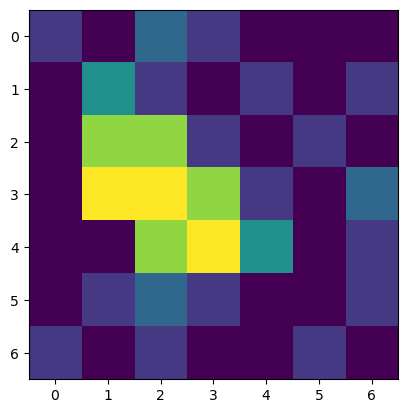
这个输出与上面的几乎相同,区别在于现在表明我们正在处理一个 Numpy array。这样的 Numpy 数组现在可以被视为一个整体,我们可以执行之前无法执行的计算:
image = np.asarray(raw_image_array)
image - 2
array([[-1, -2,  0, -1, -2, -2, -2],
       [-2,  1, -1, -2, -1, -2, -1],
       [-2,  3,  3, -1, -2, -1, -2],
       [-2,  4,  4,  3, -1, -2,  0],
       [-2, -2,  3,  4,  1, -2, -1],
       [-2, -1,  0, -1, -2, -2, -1],
       [-1, -2, -1, -2, -2, -1, -2]])
请注意,这些计算非常高效,因为它们是向量化的,即原则上可以并行执行。
两个重要的属性#
像 image 这样的数组有不同的属性。两个最重要的属性是:
数组的
shape,即行数、列数(以及多维图像的通道数、平面数等)数组的
dtype,即int64类型的图像有 2 的 64 次方个不同的灰度值。
image.shape
(7, 7)
image.dtype
dtype('int32')
创建数组的其他方法#
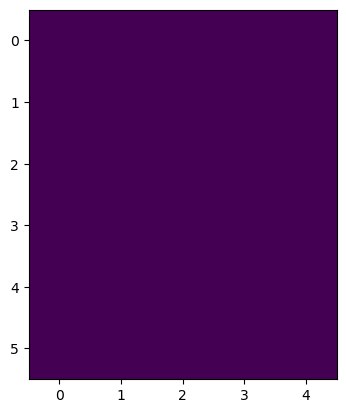
在处理图像时,我们经常创建人工图像来查看滤镜对它们的影响。例如,我们可以使用 Numpy 函数 np.zeros 创建一个所有像素值为 0 但只有一个像素不为 0 的图像。这需要指定图像大小。
image_size = (6, 5)

image1 = np.zeros(image_size)
image1
array([[0., 0., 0., 0., 0.],
       [0., 0., 0., 0., 0.],
       [0., 0., 0., 0., 0.],
       [0., 0., 0., 0., 0.],
       [0., 0., 0., 0., 0.],
       [0., 0., 0., 0., 0.]])
imshow(image1)
<matplotlib.image.AxesImage at 0x1f9fc000f10>
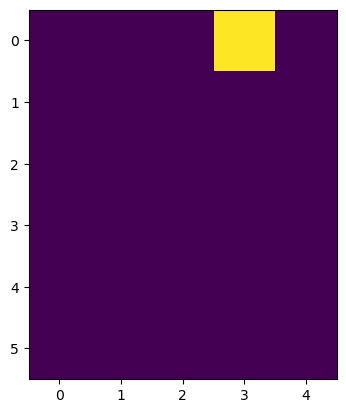
由于图像只是数组,我们只需像访问数组一样设置像素值。从这里你也可以了解到,第一个轴(坐标 0)是从上到下,而第二个轴(坐标 3)是从左到右。
image1[0,3] = 1

imshow(image1)
<matplotlib.image.AxesImage at 0x1f9fbe7ad90>
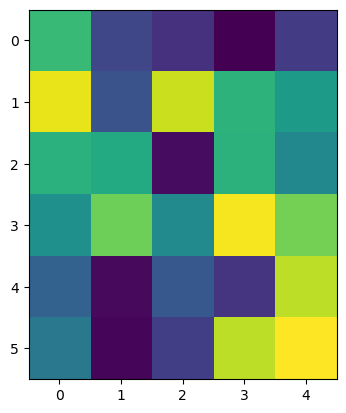
为了研究噪声,我们可以例如使用 np.random.random 创建一个具有随机值的图像。
image_random = np.random.random((6, 5))
imshow(image_random)
<matplotlib.image.AxesImage at 0x1f9fbef72e0>