打开LIF文件#
在处理显微镜图像数据时,存在许多文件格式,如徕卡图像格式(LIF)。在本笔记本中,我们将使用readlif库打开一个.lif文件。
注意:建议使用AICSImageIO来读取LIF图像,如本笔记本所示。
readlif库可以通过以下方式在终端中安装:
pip install readlif
安装完成后,就可以导入它了。
from readlif.reader import LifFile

import os
import requests
from skimage.io import imshow
import numpy as np
作为示例数据集,我们将使用由Gregory Marquart和Harold Burgess在CC-BY 4.0许可下共享的图像。我们首先需要下载它。
filename = "../../data/y293-Gal4_vmat-GFP-f01.lif"
url = 'https://zenodo.org/record/3382102/files/y293-Gal4_vmat-GFP-f01.lif?download=1'

if not os.path.isfile(filename):
    # only download the file if we don't have it yet
    response = requests.get(url)
    open(filename, "wb").write(response.content)
此时,文件应该已经在我们的计算机上,可以像这样打开。
file = LifFile(filename)
file
'LifFile object with 1 image'
lif_image = file.get_image(0)
lif_image
'LifImage object with dimensions: Dims(x=616, y=500, z=86, t=1, m=1)'
从LifImage中,我们可以获取单个帧作为PIL图像。
pil_image = lif_image.get_frame(z=0)
type(pil_image)
PIL.Image.Image
最后,这些2D PIL图像可以转换为numpy数组。这最终允许我们查看图像。
np_image = np.array(pil_image)
np_image.shape
(500, 616)
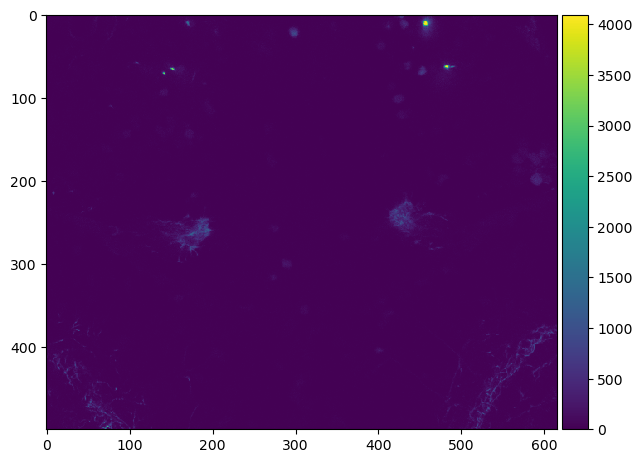
imshow(np_image)
/opt/miniconda3/envs/devbio-napari-env/lib/python3.9/site-packages/skimage/io/_plugins/matplotlib_plugin.py:149: UserWarning: Low image data range; displaying image with stretched contrast.
  lo, hi, cmap = _get_display_range(image)
<matplotlib.image.AxesImage at 0x1378ab970>
要访问我们3D图像中的所有像素,我们应该首先查看文件的元数据。
lif_image.info
{'dims': Dims(x=616, y=500, z=86, t=1, m=1),
 'display_dims': (1, 2),
 'dims_n': {1: 616, 2: 500, 3: 86},
 'scale_n': {1: 2.1354804344851965,
  2: 2.135480168493237,
  3: 0.9929687300128537},
 'path': 'Experiment_002/',
 'name': 'Series011',
 'channels': 2,
 'scale': (2.1354804344851965, 2.135480168493237, 0.9929687300128537, None),
 'bit_depth': (12, 12),
 'mosaic_position': [],
 'channel_as_second_dim': False,
 'settings': {}}
例如,知道z/y/x顺序的体素大小可能在以后会有用。
voxel_size = lif_image.info['scale'][2::-1]
voxel_size
(0.9929687300128537, 2.135480168493237, 2.1354804344851965)
我们还可以读出3D堆栈有多少个切片。
num_slices = lif_image.info['dims'].z
num_slices
86
这些信息允许我们编写一个便利函数,可以将LIF图像转换为3D numpy图像堆栈。
def lif_to_numpy_stack(lif_image):
    num_slices = lif_image.info['dims'].z

    return np.asarray([np.array(lif_image.get_frame(z=z)) for z in range(num_slices)])
image_stack = lif_to_numpy_stack(lif_image)
image_stack.shape
(86, 500, 616)
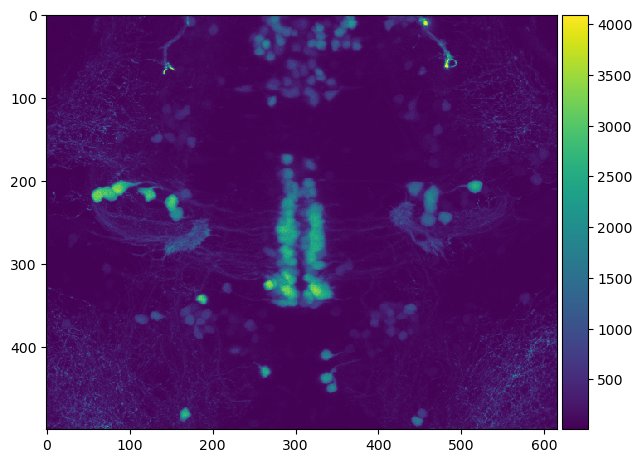
然后可以使用这个图像堆栈,例如来可视化沿Z轴的最大强度投影。
imshow(np.max(image_stack, axis=0))
<matplotlib.image.AxesImage at 0x137a1c610>