Random Forest Classifiers in scikit-learn#
In this notebook, we’ll explore how to use Random Forest Classifiers from the scikit-learn library. Random Forests are a popular ensemble learning method that combines multiple decision trees to create a more robust and accurate model.
First, let’s import the necessary libraries. We’ll use scikit-learn for the Random Forest Classifier and dataset, and matplotlib for visualization.
import numpy as np
import matplotlib.pyplot as plt
from sklearn.ensemble import RandomForestClassifier
from sklearn.datasets import make_classification
from sklearn.model_selection import train_test_split
Next, we’ll create a synthetic dataset for classification using scikit-learn’s make_classification function.
X, y = make_classification(n_samples=1000, n_features=20, n_informative=2, n_redundant=0, random_state=42)
print(f"Dataset shape: {X.shape}")
print(f"Number of classes: {len(np.unique(y))}")
Dataset shape: (1000, 20)
Number of classes: 2
Let’s split our dataset into training and testing sets to evaluate our model’s performance.
X_train, X_test, y_train, y_test = train_test_split(X, y, test_size=0.2, random_state=42)
print(f"Training set shape: {X_train.shape}")
print(f"Testing set shape: {X_test.shape}")
Training set shape: (800, 20)
Testing set shape: (200, 20)
Now, let’s create and train a Random Forest Classifier with default parameters.
rf_classifier = RandomForestClassifier(random_state=42)
rf_classifier.fit(X_train, y_train)
RandomForestClassifier(random_state=42)In a Jupyter environment, please rerun this cell to show the HTML representation or trust the notebook.
On GitHub, the HTML representation is unable to render, please try loading this page with nbviewer.org.
RandomForestClassifier(random_state=42)
We can now use our trained model to make predictions on the test set and evaluate its performance.
from sklearn.metrics import accuracy_score, classification_report

y_pred = rf_classifier.predict(X_test)
accuracy = accuracy_score(y_test, y_pred)
print(f"Accuracy: {accuracy:.2f}")
print("\nClassification Report:")
print(classification_report(y_test, y_pred))
Accuracy: 0.90

Classification Report:
              precision    recall  f1-score   support

           0       0.89      0.91      0.90        98
           1       0.91      0.89      0.90       102

    accuracy                           0.90       200
   macro avg       0.90      0.90      0.90       200
weighted avg       0.90      0.90      0.90       200
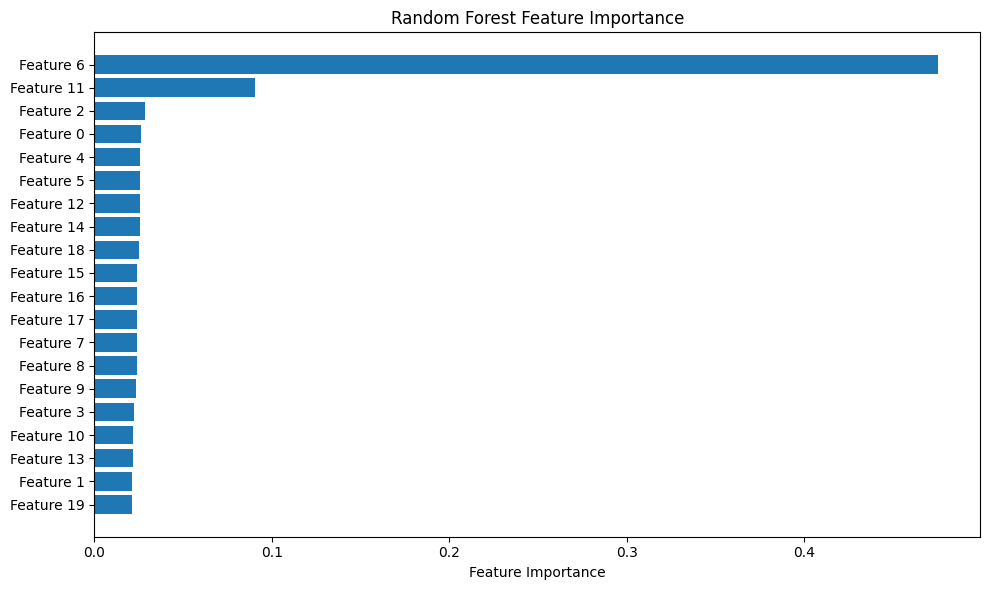
Random Forests can provide feature importance scores. Let’s visualize the importance of each feature in our model.
feature_importance = rf_classifier.feature_importances_
sorted_idx = np.argsort(feature_importance)
pos = np.arange(sorted_idx.shape[0]) + .5

fig, ax = plt.subplots(figsize=(10, 6))
ax.barh(pos, feature_importance[sorted_idx], align='center')
ax.set_yticks(pos)
ax.set_yticklabels([f'Feature {i}' for i in sorted_idx])
ax.set_xlabel('Feature Importance')
ax.set_title('Random Forest Feature Importance')
plt.tight_layout()
plt.show()
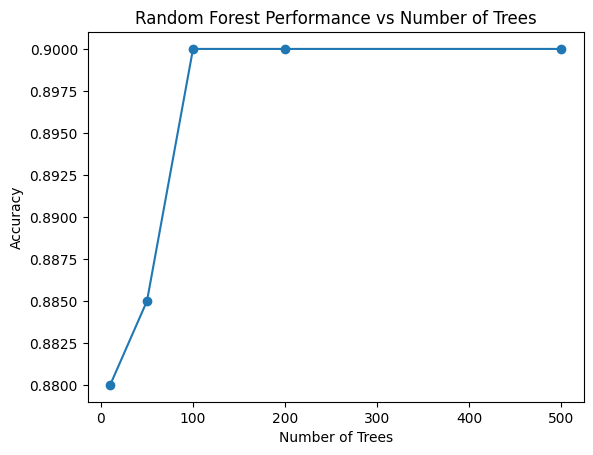
Finally, let’s examine how the number of trees in the forest affects the model’s performance.
n_estimators = [10, 50, 100, 200, 500]
accuracies = []

for n in n_estimators:
    rf = RandomForestClassifier(n_estimators=n, random_state=42)
    rf.fit(X_train, y_train)
    y_pred = rf.predict(X_test)
    accuracies.append(accuracy_score(y_test, y_pred))

plt.plot(n_estimators, accuracies, marker='o')
plt.xlabel('Number of Trees')
plt.ylabel('Accuracy')
plt.title('Random Forest Performance vs Number of Trees')
plt.show()
This notebook has introduced you to Random Forest Classifiers in scikit-learn. We’ve covered creating a synthetic dataset, training a model, evaluating its performance, visualizing feature importance, and examining the effect of the number of trees on model accuracy.